BlackBerry device maker, RIM, report its the 3rd quarter results after the bell, as expected, the company's earnings were significantly impeded by the global economy slow down, GAAP net income increased about 7.0% from $370mm to $396mm ($0.70 vs $0.66 per share) with revenue coming in at $2.8 billions.
Most interesting to me in the earning release, though, was that RIMM sold 6.7 million BlackBerry devices and booked $2.3 billion revenue. For comparison, in AAPL last quarter (ended 9/27/08), AAPL sold 6.9 million iPhone, but only $806 millions revenue was recognized. So even about 200,000 more iPhone were sold with assumed higher ASP than Blackberries in three month period, AAPL booked 2/3 less revenue than RIMM. The culprit is that AAPL book its iPhone sales using so-called "subscription accounting", namely recognized revenue over 24 month period, but not as sales occur. When AAPL only sold average about 1 mm iPhone in each previous few quarters, iPhone sales have limited impacts on its bottom lines and valuation measures. The exploding growth of 3G iPhone and increasing importance in AAPL's product/revenue mix present difficulties to make a fair relative market valuation comparing to RIMM because the iPhone deferred revenues were entered as liabilities, which offset by cash in its balance sheet. In the latest AAPL quarterly financials, the total liabilities on B/S was $18 billions, but almost a half of this ($8.5 billions) belongs to deferred revenues mostly attributed to iPhone!
What if AAPL booked iPhone revenue the same way as RIMM did with Blackberries? It is almost impossible to re-structure AAPL's financial statements without detail breakdown iPhone sales data. But based on AAPL published financials, we can make some basic estimated adjustments on AAPL's market measurements assuming current margin remains constant. The table below lists fiscal 2008 iPhone units (company's earning release) sold and GAAP revenues booked by AAPL and pro forma revenue if AAPL book iPhone sales as RIMM would.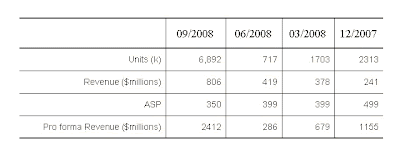 So AAPL would recognize $4.5 billion sales from iPhone, instead of only $1.8 billions as reported for the fiscal year 08. Also worth to note though, $4.5 billions is just about 1/2 of the deferred revenue. AAPL actual earnings for fiscal 08 should have been about $6.13 per share, a 15% higher than reported of $5.36.
Comparing to the new tech companies, namely RIMM and GOOG, as well as some "old" large tech names, like MSFT and CSCO, AAPL has been traded at significant discount to these companies using current reported financials. If AAPL uses the same accounting rule to recognize iPhone sales as Blackberry, AAPL would be valued even much deep discount by most valuation measures such as Price/Sale, Price/Book and EV/Sale and cash flow (see table below). Market values AAPL at discount to its peers may be partly due to analyst's underestimates of iPhone earning powers. Another factor is that AAPL has always try to tamper and manage sometimes over-optimistic/unrealistic market expectations over new products or earning growth. On the contrary, if you read RIMM's latest earning reports, you can sense/see that the management have tried very hard (excluding "unfavorable" currency movement) to meet market expectations and try to paint much rosy picture. There is no question that Steve Job's health and succession plan may be a much bigger drag for the valuation, but it seems that current AAPL market valuation may have priced this adversary information already. Be prepared for the positive surprise in the coming earning report on 1/20.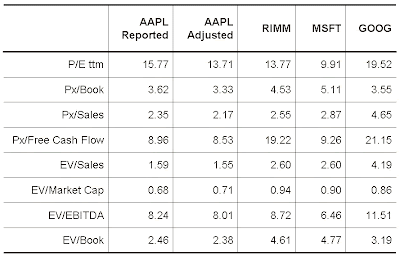
What if AAPL booked iPhone revenue the same way as RIMM did with Blackberries? It is almost impossible to re-structure AAPL's financial statements without detail breakdown iPhone sales data. But based on AAPL published financials, we can make some basic estimated adjustments on AAPL's market measurements assuming current margin remains constant. The table below lists fiscal 2008 iPhone units (company's earning release) sold and GAAP revenues booked by AAPL and pro forma revenue if AAPL book iPhone sales as RIMM would.
So AAPL would recognize $4.5 billion sales from iPhone, instead of only $1.8 billions as reported for the fiscal year 08. Also worth to note though, $4.5 billions is just about 1/2 of the deferred revenue. AAPL actual earnings for fiscal 08 should have been about $6.13 per share, a 15% higher than reported of $5.36.Comparing to the new tech companies, namely RIMM and GOOG, as well as some "old" large tech names, like MSFT and CSCO, AAPL has been traded at significant discount to these companies using current reported financials. If AAPL uses the same accounting rule to recognize iPhone sales as Blackberry, AAPL would be valued even much deep discount by most valuation measures such as Price/Sale, Price/Book and EV/Sale and cash flow (see table below). Market values AAPL at discount to its peers may be partly due to analyst's underestimates of iPhone earning powers. Another factor is that AAPL has always try to tamper and manage sometimes over-optimistic/unrealistic market expectations over new products or earning growth. On the contrary, if you read RIMM's latest earning reports, you can sense/see that the management have tried very hard (excluding "unfavorable" currency movement) to meet market expectations and try to paint much rosy picture. There is no question that Steve Job's health and succession plan may be a much bigger drag for the valuation, but it seems that current AAPL market valuation may have priced this adversary information already. Be prepared for the positive surprise in the coming earning report on 1/20.