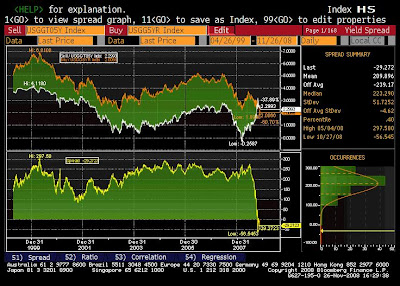
The financial chaos and sudden downward spiral of global economy have created a wide spread fear in the market places that the impending risk is the possibility of deflation as Japan had experienced in the last decade. This left "real" yield on current 5 yr treasury TIPS at 2.293%, about 29 bps HIGHER than the nominal yield on its big brother, 5-yr treasury note, which was traded at about 2.00%. The yield differences between 5 yr note and TIPS reached at par about a month ago and have steadily declined into negative territories (see the Bloomberg chart below). The spread for 10yr sector also collapsed from long term historical average 210 bps to only a few basis points above zero according to Bloomberg data.
What market offer now for investors is you can lock-in at least 2.20% "real" yield if the security is hold until maturity and if there is any positive inflation comparing to the negative "real" yield for the nominal treasury notes. The only risk to hold TIPS now is that the US economy DOES slid into extended period deflation, which would erode capital (inflation) of the total return components. We can also look TIPS in another way, since the real yield on TIPS is higher than or at par with nominal bonds, investor effectively get inflation component of return for free. In the case of 5 year sector, investors were paid over 20 bps for to own TIPS!
The fear of deflation is extremely overblown, first of all, the latest significant declining headline CPI was mainly attributed to the unprecedented crash in commodities. The October core reading was down about 0.1% from September, but still remain at 2.2% YOY. The deflation pressure is likely temporary or transitional in normal business cycle. We can not ignore the fact that Japanese made her mistakes for taking too long to make the fiscal and monetary policy adjustments. We have witnessed coordinated efforts from central banks across the globe to pump up liquidity and unfreeze credit markets. Even the credit market is still fragile but has improved significantly measured by many credit spreads. Another important aspect is that cultural and social differences between US and Japan, or in broad sense, the West and East Asia. In the eastern culture societies, especially Japanese and Chinese, savings and risk aversion are deep rooted and highly regarded merits. Consumer consumption is the major driver for GDP growth. Contrast to the East, US is proud of risk taking and consumption dominates social and daily life. The cost of money is effective negative (fed funds target 1.00%, but has traded between 0.125-0.75% for a quite while) for banks and some financial or other institutions if inflation is taken into consideration, . If Fed does what market has expected in its meeting next month, the stated Fed funds would be close to zero even in nominal term. When you literally drop money from helicopter, it is only when not if the rationality and reality will settle in. Risk taking by business and consumers will be back. The most likely outcome in the 2-5 horizon is not deflation but rather inflation considering the enormous monetary stimulus (Uncle Sam has committed about 7-8 trillions according to Bloomberg, about a half of GDP, Chinese also plan about $600 billions efforts.) Most of time, if not all the time, what everyone has expected rarely turn out to be true because of the forward looking nature of market.
Total return for 5 yr TIPS is expected to be at about 7.00-8.00% depending on inflation expectation (3.00-4.10%), and close to 4.00% even with zero inflation assuption if hold security to 5 yr maturity. For an investment instrument, when there is no credit risk and highly remote chance principal erosion from deflation, this may just one of those rare opportunities.
What market offer now for investors is you can lock-in at least 2.20% "real" yield if the security is hold until maturity and if there is any positive inflation comparing to the negative "real" yield for the nominal treasury notes. The only risk to hold TIPS now is that the US economy DOES slid into extended period deflation, which would erode capital (inflation) of the total return components. We can also look TIPS in another way, since the real yield on TIPS is higher than or at par with nominal bonds, investor effectively get inflation component of return for free. In the case of 5 year sector, investors were paid over 20 bps for to own TIPS!
The fear of deflation is extremely overblown, first of all, the latest significant declining headline CPI was mainly attributed to the unprecedented crash in commodities. The October core reading was down about 0.1% from September, but still remain at 2.2% YOY. The deflation pressure is likely temporary or transitional in normal business cycle. We can not ignore the fact that Japanese made her mistakes for taking too long to make the fiscal and monetary policy adjustments. We have witnessed coordinated efforts from central banks across the globe to pump up liquidity and unfreeze credit markets. Even the credit market is still fragile but has improved significantly measured by many credit spreads. Another important aspect is that cultural and social differences between US and Japan, or in broad sense, the West and East Asia. In the eastern culture societies, especially Japanese and Chinese, savings and risk aversion are deep rooted and highly regarded merits. Consumer consumption is the major driver for GDP growth. Contrast to the East, US is proud of risk taking and consumption dominates social and daily life. The cost of money is effective negative (fed funds target 1.00%, but has traded between 0.125-0.75% for a quite while) for banks and some financial or other institutions if inflation is taken into consideration, . If Fed does what market has expected in its meeting next month, the stated Fed funds would be close to zero even in nominal term. When you literally drop money from helicopter, it is only when not if the rationality and reality will settle in. Risk taking by business and consumers will be back. The most likely outcome in the 2-5 horizon is not deflation but rather inflation considering the enormous monetary stimulus (Uncle Sam has committed about 7-8 trillions according to Bloomberg, about a half of GDP, Chinese also plan about $600 billions efforts.) Most of time, if not all the time, what everyone has expected rarely turn out to be true because of the forward looking nature of market.
Total return for 5 yr TIPS is expected to be at about 7.00-8.00% depending on inflation expectation (3.00-4.10%), and close to 4.00% even with zero inflation assuption if hold security to 5 yr maturity. For an investment instrument, when there is no credit risk and highly remote chance principal erosion from deflation, this may just one of those rare opportunities.